NMO S5 Final | BUSINESS CASE SCENARIO - 15
Submission BCS
A Visionary Approach for DND's Journey: From Challenges to Triumphs
Submission Date & Time: 2023-12-03 23:30:41
Event Name: NMO Season 5 Final
Solution Submitted By: Shrutika Sandesh Shelke
Assignment Taken
Leadership: Empowering DND to deliver seamless, reliable, and quality daily needs, fostering customer trust, and enhancing operational efficiency for sustained growth.Case Understanding
Daily Needs Delivery (DND) is an Indian startup founded by Sam Malhotra and Rajish Gupta in 2020. With a focus on daily essentials, the app-based platform operates in three cities—Bengaluru, Delhi, and Hyderabad—offering products like milk, paneer, and curd. The founders, from diverse backgrounds, pooled INR 15 lakhs as seed capital and incorporated key features like subscription services and BHIM UPI for wallet recharge. Key Challenges: 1. Missing Deliveries and Customer Complaints: i. Customers report missing deliveries despite delivery partners' claims. ii. Difficulty in addressing customer feedback due to potential underreporting. 2. Unreliable Delivery Partner Attendance: i. Delivery partners sporadically fail to report for duty, disrupting deliveries. ii. Resultant losses impact business operations and product quality. 3. Product Errors and Quality Issues: i. Customers complain about incorrect or missing products. ii. Complaints regarding foul smells and bad taste impact customer satisfaction. 4. Perishable Product Losses: i. DND faces a 0.2% loss in sourced inventory due to product perishability. ii. Strategies required to minimize losses and improve inventory management. 5. Unfulfilled Services in Non-Dense Areas: i. Subscribers in non-dense areas face delayed or unfulfilled services. ii. Risk of losing subscribers and facing refund claims. 6. Competition Exploiting Weaknesses: i. Traditional competitors and new entrants capitalize on DND's operational challenges. ii. Threatens market share and brand reputation. Key Resources: 1. Human resources a. Hyper-Local Delivery Team (80 members): Essential for last-mile delivery and customer interactions. b. Corporate Office Team (10 members): Manages overall operations, customer service, and strategic decisions. 2. App-Based Ordering System: Critical for customer engagement and order management. Requires enhancements to improve user experience and facilitate feedback. 3. Product Range (Milk, Paneer, Curd): Core offerings, necessitating quality control and efficient supply chain management. Strategies to minimize perishable losses and ensure product quality. 4. Seed Capital (INR 15 Lakhs): Initial financial support for startup operations. Future funding required for addressing operational challenges and expansion. 5. Strong Sales Team (3 members): Instrumental in subscriber acquisition and sales strategy. Requires alignment with delivery operations to ensure promised services.BCS Solution Summary
The vision of the company is to emerge as a premier daily essentials provider, characterized by a customer-centric ethos. This entails prioritizing customer satisfaction, trust-building, and delivering seamless experiences. The mission revolves around transforming daily delivery by leveraging technology, fostering trust, and upholding environmental responsibility. Guided by leadership principles, the organization focuses on operational optimization through efficient and innovative processes. Strategic expansion is pursued with a keen eye on viability, while continuous development and technology integration underscore the commitment to innovation. Quality assurance is paramount, maintained through rigorous control measures, and competitive analysis ensures the organization remains agile in responding to dynamic market forces. Objectives: 1. Enhance Customer Satisfaction: Improve satisfaction by 20% through effective complaint resolution. 2. Strengthen Operational Reliability: Achieve a 30% reduction in missed deliveries and discrepancies. 3. Optimize Logistics and Minimize Losses: Decrease perishable losses from 0.2% to 0.1% through advanced supply chain management. 4. Expand Services Strategically: Launch services in non-dense areas with a focus on financial viability. 5-Year Vision: 1. Achieve 1.5 million app users and Rs. 4,500 Cr annual revenue by FY2026-27. 2. Promote "Vocal for Local" by reducing costs through local supplier contracts. 3. Increase market share through strategic marketing and expansion initiatives.Solution
Management Principles:
Leadership:
- Customer-Centric Approach
- Operational Optimization
- Innovation and Technology Integration
- Strategic Expansion
- Quality Assurance
- Competitive Analysis and Response
Finance:
- Profit loss analysis
- Break-even analysis
- Budget allocation
Marketing:
- Customer acquisition cost analysis
- Competitive benchmarking
- Industry analysis – PESTEL
- Company analysis – Porter’s 5 forces
HR:
- Employee satisfaction
- Reduction in attrition rate
- Focus of training & development
IT & Business Analytics:
- Continuous development of App
- Technology integration to reduce no. of complaints regarding delivery persons
Vision:
To be the foremost provider of daily essentials, enriching lives by seamlessly connecting communities with a reliable and innovative daily needs delivery experience.
Mission:
At Daily Needs Delivery (DND), our mission is to redefine and elevate the daily essentials delivery landscape by leveraging technology, fostering trust, and prioritizing customer satisfaction. We are committed to ensuring the seamless availability of high-quality products, backed by efficient delivery services, while empowering local communities and sustaining our commitment to environmental responsibility.
Objectives:
- Enhancement of Customer Satisfaction and Trust: Improve customer satisfaction by 20% in the next fiscal year through prompt resolution of complaints, enhanced communication channels, and rigorous quality control measures, fostering lasting trust with our customer base.
- Strengthen Operational Reliability: Achieve a 30% reduction in missed deliveries and product discrepancies in the next six months by implementing a robust tracking system, enhancing delivery partner training, and conducting regular audits to enhance operational reliability and efficiency.
- Optimize Logistics and Minimize Perishable Losses: Decrease perishable losses from 0.2% to 0.1% in the next quarter by implementing advanced supply chain management, enhancing inventory forecasting, and adopting innovative storage solutions, contributing to cost savings and sustainability through optimized logistics.
- Expand Services in Non-Dense Areas Strategically: Launch services in non-dense areas, targeting break-even within a year, through thorough market analysis, identifying subscriber bases, and implementing cost-effective expansion strategies to tap into new markets with financial viability.
Industry Overview:
Hyperlocal delivery startups deliver goods from local stores to end consumers through a fleet of delivery agents. They also allow consumers to place generic orders which can be fulfilled from any store. The hyperlocal delivery apps market in India was valued at US$ 46.3 million in 2021. It is projected to register a CAGR of around 30.4% between 2022 and 2032. In 2022, there were 141 million hyperlocal e-commerce shoppers in India. This number was expected to grow to 214 million by the end of the year.
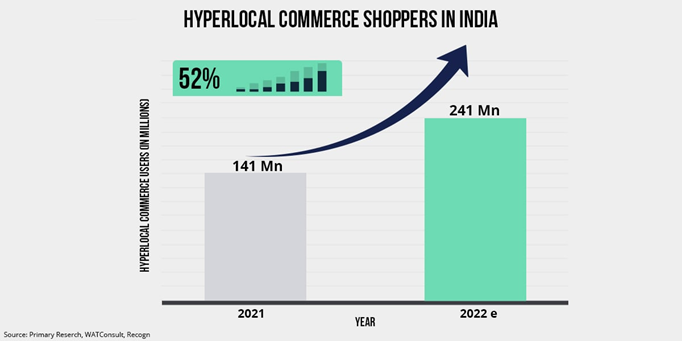
Also, The Indian government has implemented initiatives such as Startup India, Make in India, and Digital India to support entrepreneurship, manufacturing, and digital transformation. Additionally, programs like the National Handloom Development Programme and One District One Product Scheme focus on promoting local industries and unique products in specific regions. The Atmanirbhar Bharat Abhiyan, launched in 2020, aims to foster self-reliance and boost local manufacturing to reduce dependence on imports. The below graph shows increasing investment in Indian Hyperlocal sector.
Key drivers of hyperlocal retail in India:
- The increasing purchasing power of Indian consumers
- Growing penetration of digital technologies in rural areas
- Increase in the number of start-ups
- Consumers' preference for on-demand delivery
- Need for contactless delivery
- Government initiatives
Market Analysis & Competition:
|
Bigbasket |
Blink It |
Dunzo |
Zepto |
Nature’s Basket |
Country Delight |
|
|---|---|---|---|---|---|---|
|
Services offered |
Grocery, Fresh Produce, Household Items, Personal Care |
Groceries, Daily Essentials, Medicines, Electronics |
Grocery, Medicine, Food, Pet Supplies, Courier, etc. |
Grocery, Fresh Produce, Household Essentials, Snacks |
Gourmet Foods, Fresh Produce, International Brands |
Dairy Products (Milk, Paneer, Curd) |
|
Delivery charges |
Varies based on order value and delivery slot |
Dynamic, depends on location and urgency |
Dynamic pricing, influenced by distance |
Flat delivery fee with free delivery options |
Based on order value and delivery location |
Subscription-based, free delivery with plans |
|
Delivery time |
Based on slots within a day |
10 min (subjected to location & other circumstances) |
10-15 min (subjected to location & other circumstances) |
10 min (subjected to location & other circumstances) |
Dependent on order specifics |
As per subscription schedule |
|
No. of Active users |
9 million |
2.3 million |
5.1 million |
4.75 million |
NA |
1.5 million |
Company Analysis:
As we can see in the above table, annual sales are increasing. Also our app users also increased by 60% from FY 2020-21 to FY 2021-22, however, no. of inactive app users also increased at alarming rate. This indicates that may be our customers either stopped using the service or they shifted to some other competitor of ours.
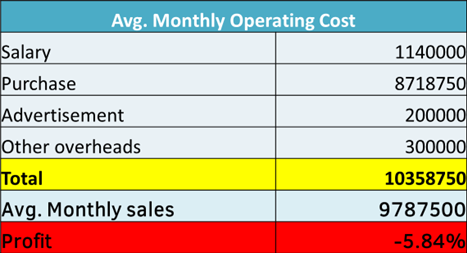
From above table we can see that our profit margins are negative, we can cut the costs in order to improve the profit margin.
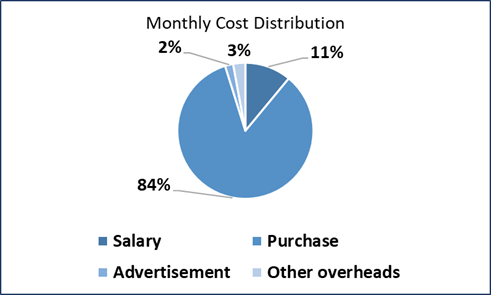
From the cost distribution, it is evident that major chunk of monthly budget is consumed by purchases. By shifting to local vendors, we can reduce these costs.
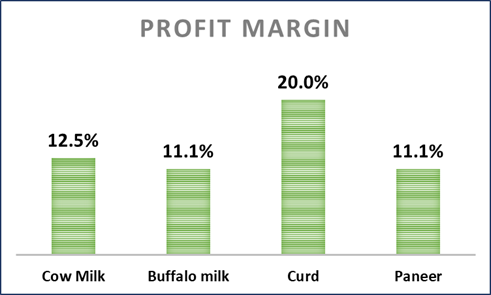
From this comparison of profit margin per product, it is evident that curd is the most profitable product. So, we can focus more on the same.
SWOT Analysis:
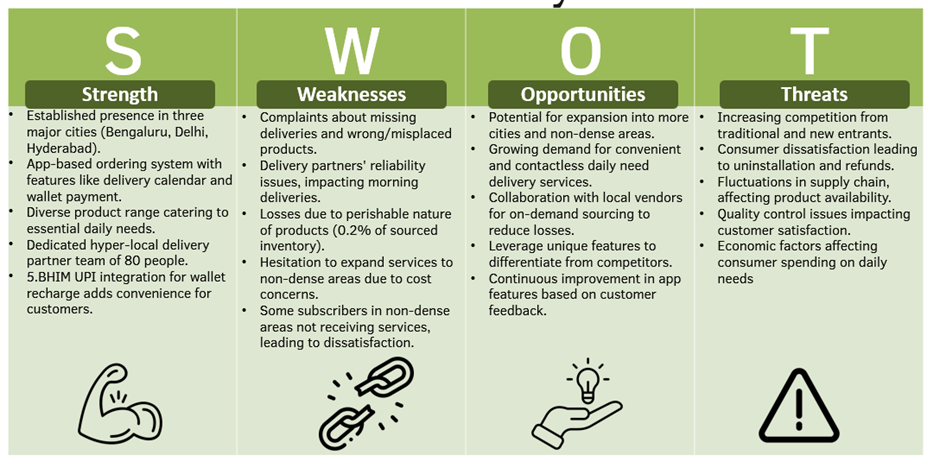
Below is the companies SWOT analysis.
5 years Vision document:
- 1.5 million users by FY2026-27
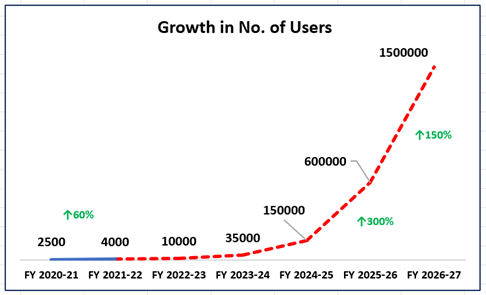
Based on current rate of growth, we should be able to achieve 1.5 million app users at the end of FY2026-27
- 4500 Cr Annual revenue by FY 2026-27
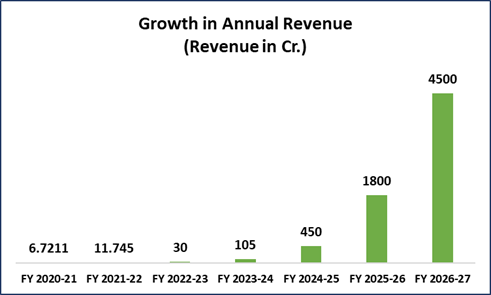
Average basket size of customer was Rs. 26884 in FY 2020-21 and Rs. 29362 in FY 2021-22. Based on that it is assumed that in average basket size in FY 2022-23 will be Rs. 30000. Considering 1.5 million users in FY 2026-27, annual revenue will be Rs. 4500 Cr.
- Vocal for local
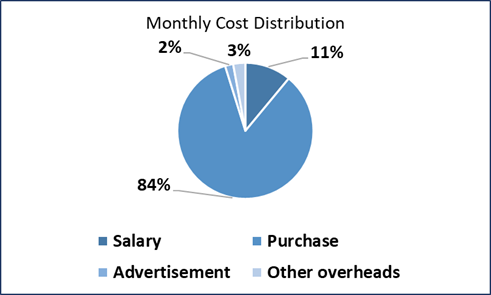
From above graph, it is evident that major chunk of budget is consumed by purchases. To reduce this, we can consider local suppliers for our products. We can form long term contracts with suppliers to achieve cost reduction.
- Increased Market share
Over the next 5 years, Daily Needs Delivery LLP aims to increase its market share by implementing strategic marketing initiatives, expanding services to untapped regions, enhancing customer satisfaction through innovative features, and fostering brand loyalty through targeted retention programs. Regular performance reviews and agility in adapting to market dynamics will be key to achieving this goal.
Department wise Plan:
Finance Department:
- Cost of Goods Sold (COGS) Percentage:
Action Plan:
Conduct a thorough review of supply chain and procurement processes to identify cost-saving opportunities.
Explore partnerships with suppliers to negotiate better terms and bulk purchase discounts.
- Profit Margin:
Action Plan:
Implement dynamic pricing strategies based on demand, delivery locations, and product popularity.
Continuously monitor and analyze expenses to identify areas for cost reduction without compromising quality.
- Inventory Turnover Ratio:
Action Plan:
Optimize inventory management systems to minimize holding costs.
Regularly assess product demand patterns and adjust procurement strategies accordingly.
- Cash Conversion Cycle:
Action Plan:
Streamline billing and payment processes to reduce the time it takes to convert sales into cash.
Negotiate favorable payment terms with suppliers to improve working capital efficiency.
Marketing Department:
- Customer Acquisition Cost (CAC):
Action Plan:
Conduct a comprehensive analysis of marketing channels to identify the most cost-effective ones.
Implement referral programs or incentives to encourage existing customers to refer new ones.
- Conversion Rate:
Action Plan:
A/B test different elements of the app and marketing messages to optimize for conversion.
Personalize marketing campaigns based on user behavior and preferences.
- Brand Awareness Index:
Action Plan:
Invest in local marketing initiatives in target cities to increase brand visibility.
Collaborate with influencers or local communities to organically boost brand awareness.
- Subscriber Churn Rate:
Action Plan:
Analyze customer feedback to identify pain points and address them promptly.
Implement targeted retention campaigns and loyalty programs to increase subscriber satisfaction.
HR (Human Resources) Department:
- Employee Satisfaction Score (ESS):
Action Plan:
Conduct regular employee surveys to gather feedback and identify areas for improvement.
Establish open communication channels for employees to voice concerns and suggestions.
- Training Effectiveness Index:
Action Plan:
Periodically evaluate training programs through assessments and post-training evaluations.
Offer ongoing learning opportunities and ensure that training content aligns with business objectives.
- Average Time to Fill Vacancies:
Action Plan:
Streamline the recruitment process, from job posting to onboarding, to reduce time-to-fill.
Maintain a talent pool and network to proactively address staffing needs.
- Absenteeism Rate:
Action Plan:
Analyze absenteeism patterns to identify root causes and address them.
Introduce flexible work arrangements or wellness programs to enhance employee well-being.
IT (Information Technology) Department:
- App Uptime Percentage:
Action Plan:
Implement robust monitoring tools to identify and address downtime issues promptly.
Conduct regular system audits and invest in scalable infrastructure to handle increased demand.
- Cybersecurity Incident Rate:
Action Plan:
Enhance cybersecurity measures through regular employee training on security best practices.
Collaborate with cybersecurity experts to conduct regular audits and vulnerability assessments.
- App User Engagement Metrics:
Action Plan:
Analyze user feedback and behavior to identify features that enhance engagement.
Regularly update the app with new features and improvements based on user preferences.
- Technology ROI (Return on Investment):
Action Plan:
Conduct a comprehensive review of existing technology investments to assess their impact on business goals.
Align IT initiatives with strategic business objectives to ensure a measurable return on investment.
5 year – Roadmap:
Year 1:
|
Goal |
Actions |
|---|---|
|
Reduce COGS Percentage by 5% |
Conduct a comprehensive supply chain audit. Implement cost-saving measures identified. |
|
Decrease CAC by 10% |
Analyze and optimize marketing channels. Implement referral programs and incentives. |
|
Increase Employee Satisfaction Score by 5% |
Implement regular employee surveys. Establish open communication channels for feedback. |
|
Achieve 99% App Uptime |
Implement robust monitoring tools. Conduct regular system audits. |
Year 2
|
Goal |
Actions |
|---|---|
|
Increase Profit Margin by 2% |
Optimize pricing strategies based on product demand. Identify and reduce non-essential expenses. |
|
Increase Conversion Rate by 3% |
Conduct A/B testing for app and marketing messages. Personalize campaigns based on user behavior. |
|
Improve Training Effectiveness Index by 10% |
Evaluate training programs through assessments and post-training evaluations. Offer ongoing learning opportunities. |
|
Decrease Cybersecurity Incident Rate by 15% |
Enhance employee cybersecurity training. Collaborate with experts for regular audits. |
Year 3
|
Goal |
Actions |
|---|---|
|
Improve Inventory Turnover Ratio by 10% |
Implement real-time inventory tracking. Adjust procurement strategies based on demand patterns. |
|
Boost Brand Awareness Index by 15% |
Invest in local marketing initiatives in target cities. Collaborate with influencers and local communities. |
|
Reduce Average Time to Fill Vacancies by 20% |
Streamline recruitment processes. Maintain a talent pool and network. |
|
Increase App User Engagement Metrics by 10% |
Analyze user feedback and behavior. Regularly update the app with new features. |
Year 4
|
Goal |
Actions |
|---|---|
|
Decrease Cash Conversion Cycle by 15 days |
Streamline billing and payment processes. Negotiate favorable payment terms with key suppliers. |
|
Reduce Subscriber Churn Rate by 8% |
Analyze customer feedback and address pain points. Implement targeted retention campaigns and loyalty programs. |
|
Decrease Absenteeism Rate by 8% |
Analyze absenteeism patterns and address root causes. Introduce flexible work arrangements and wellness programs. |
|
Maximize Technology ROI |
Conduct a comprehensive review of existing technology investments. Align IT initiatives with strategic business objectives. |
Year 5
|
Goal |
Actions |
|---|---|
|
Achieve 20% Reduction in Perishable Losses |
Enhance inventory management systems. Explore partnerships with local vendors for on-demand sourcing. |
|
Expand Services to 2 New Cities |
Conduct a cost-benefit analysis for expansion. Develop targeted marketing campaigns for new locations. |
|
Enhance Leadership Development Programs |
Identify high-potential employees. Implement targeted leadership development initiatives. |
|
Implement Advanced Predictive Analytics |
Upgrade systems to support advanced analytics. Implement predictive analytics for demand forecasting and user behavior. |
Additional Task:
Performance Indicators for each department:
Leadership:
- Market Expansion Rate (MER): Percentage increase in the number of cities served by DND.
- Customer Satisfaction Index (CSI): Aggregate score reflecting customer satisfaction with DND services.
- Employee Retention Rate: Percentage of employees, especially at leadership levels, retained over a specific period.
- Innovation Adoption Rate: Percentage increase in the adoption of new features or improvements in the DND app.
Finance:
- Cost of Goods Sold (COGS) Percentage: Percentage of revenue spent on producing and delivering goods.
- Profit Margin: Percentage of revenue retained as profit after covering all expenses.
- Inventory Turnover Ratio: Number of times inventory is sold and replaced over a specific period.
- Cash Conversion Cycle: Days it takes for a company to convert its investments in inventory and other resources into cash.
Marketing:
- Customer Acquisition Cost (CAC): Average cost to acquire a new customer.
- Conversion Rate: Percentage of app visitors who become subscribers.
- Brand Awareness Index: Survey-based measurement of brand awareness in target cities.
- Subscriber Churn Rate: Percentage of subscribers who uninstall the app or claim refunds.
HR (Human Resources):
- Employee Satisfaction Score (ESS): Aggregate score reflecting employee satisfaction with their workplace.
- Training Effectiveness Index: Assessment of how well employees apply training to their roles.
- Average Time to Fill Vacancies: Average time taken to fill open positions within the company.
- Absenteeism Rate: Percentage of scheduled work hours that employees miss.
IT (Information Technology):
- App Uptime Percentage: Percentage of time the DND app is available and operational.
- Cybersecurity Incident Rate: Number of cybersecurity incidents per month.
- App User Engagement Metrics: Metrics such as daily active users, session duration, and feature usage.
- Technology ROI (Return on Investment): Measurement of the return on investment for technology-related initiatives.
Appendix & Exhibits:
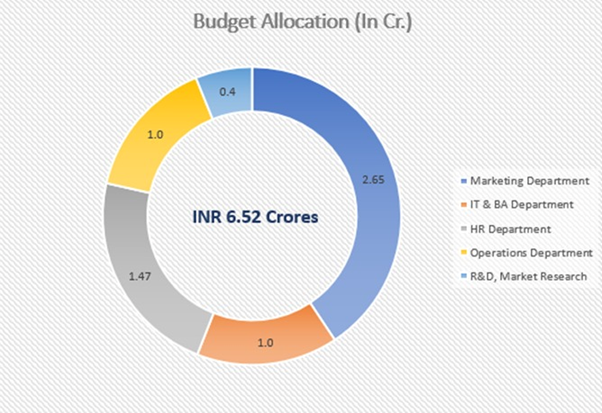
Final Budget Allocation:
References:
https://www.linkedin.com/pulse/hyperlocal-market-trillion-dollar-opportunity-mayur-potdar/
Conclusion
In conclusion, Daily Needs Delivery LLP (DND) is poised for significant growth, driven by a customer-centric vision, innovative leadership principles, and a commitment to operational excellence. The comprehensive five-year plan, spanning departments from finance to IT, strategically addresses challenges such as perishable losses and delivery discrepancies. DND's industry analysis reflects a thriving hyperlocal market in India, aligning with its expansion goals. The SWOT analysis highlights the importance of leveraging strengths, addressing weaknesses, and capitalizing on market opportunities. With a focus on financial sustainability, customer satisfaction, and community empowerment, DND's proactive approach positions it as a leader in the evolving hyperlocal delivery sector. The strategic synergy with government initiatives, coupled with a resilient organizational culture, positions DND for success in navigating challenges and emerging as a trailblazer in the essential services landscape.Attached File Details
View Attachment file (Final round_Team Agile Strategists_Shrutika Shelke.pdf)Comments
Article Type: Business Case Scenario, Case Study Solution Submission
Business Case Detail
Title: NMO S5 Final | BUSINESS CASE SCENARIO - 15
Type: Case Study
Stream: Management
Team Strategic Achievers - NMO S5 Final
Total Team Points: 121000
Team Agile Strategists - NMO S5 Final
Total Team Points: 126500